
Perl scripts analyze Jawbone UP data
Moving Circle

The Jawbone UP electronic bracelet measures the wearer's daily activity and nocturnal sleep patterns. If you are bored by the official smartphone app, you can create your own Perl scripts and access your data via the unofficial web API.
To counter the widespread tendency to excessive body fat, many smartphone owners now carry little gadgets around with them, reminding them of their lack of physical activity during the day. If you sit motionless for hours in front of the screen, the idea is that such a device could motivate you to walk around the block more often, or at least use the upstairs bathroom. This trend toward self-measurement – known as quantifying yourself – has grown very popular lately.
An electronic bracelet like the UP [1] by Jawbone measures the steps you take and shows the distance traveled and calories burned in the associated smartphone app (Figure 1). The accessory is available in three sizes and several colors and costs about US$ 130. From a functional point of view, the device seems to capture only instantaneous acceleration values and accumulates them over time. The geographical position of the wearer could be determined with a GPS chip, but this added function would probably drain the device's small battery in next to no time.
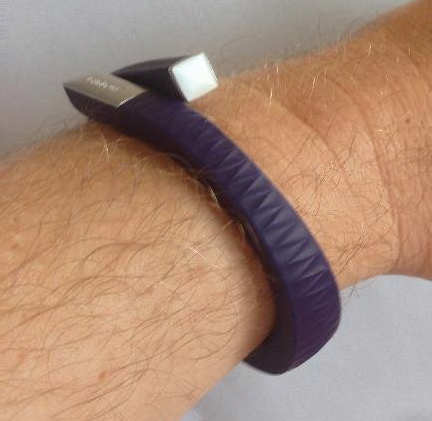 Figure 1: The Jawbone UP bracelet tallies its wearer's physical activity during the day by tracking acceleration.
[...]
Buy this article as PDF
(incl. VAT)
Buy Linux Magazine
Subscribe to our Linux Newsletters
Find Linux and Open Source Jobs
Subscribe to our ADMIN Newsletters
Support Our Work
Linux Magazine content is made possible with support from readers like you. Please consider contributing when you’ve found an article to be beneficial.

News
-
System76 Retools Thelio Desktop
The new Thelio Mira has landed with improved performance, repairability, and front-facing ports alongside a high-quality tempered glass facade.
-
Some Linux Distros Skirt Age Verification Laws
After California introduced an age verification law recently, open source operating system developers have had to get creative with how they deal with it.
-
UN Creates Open Source Portal
In a quest to strengthen open source collaboration, the United Nations Office of Information and Communications Technology has created a new portal.
-
Latest Linux Kernel RC Contains Changes Galore
Linux kernel 7.0-rc3 includes more changes than have been made in a single release in recent history.
-
Nitrux 6.0 Now Ready to Rock Your World
The latest iteration of the Debian-based distribution includes all kinds of newness.
-
Linux Foundation Reports that Open Source Delivers Better ROI
In a report that may surprise no one in the Linux community, the Linux Foundation found that businesses are finding a 5X return on investment with open source software.
-
Keep Android Open
Google has announced that, soon, anyone looking to develop Android apps will have to first register centrally with Google.
-
Kernel 7.0 Now in Testing
Linus Torvalds has announced the first Release Candidate (RC) for the 7.x kernel is available for those who want to test it.
-
Introducing matrixOS, an Immutable Gentoo-Based Linux Distro
It was only a matter of time before a developer decided one of the most challenging Linux distributions needed to be immutable.
-
Chaos Comes to KDE in KaOS
KaOS devs are making a major change to the distribution, and it all comes down to one system.