Comparing the Top, Htop, Atop, and Glances system monitors
Trackers
© Lead Image © Barna Tanko, 123RF.com
The Top system monitor is a useful aid for identifying system bottlenecks, and Htop, Atop, and Glances extend its possibilities.
The Top utility has served as a general-purpose system monitor on Linux systems for many years. Top originally appeared as part of the procps package [1]. Debian, Fedora, and openSUSE forked the original package and released procps-ng version 3.3.0 [2] at the end of 2011. The new Top impresses with many new fields, simpler operation, and better performance. Resourceful developers have also devised alternatives to the Top utility, including Htop [3], Atop [4], and most recently the Python program Glances [5] (see Table 1 for a comparison of features).
Table 1
Feature Comparison
| Function | Top | Htop | Atop | Glances |
|---|---|---|---|---|
| Recording |
– |
– |
X |
– |
| Reports |
– |
– |
X |
– |
| Tagging bottlenecks |
– |
In part |
X |
X |
| Adjusting the header |
X |
X |
Automatic, in part |
X |
| Customizing the fields in process list |
X |
X |
Predefined views |
– |
| Network traffic per process |
– |
– |
With kernel module |
– |
| Multiple views at the same time |
X |
– |
– |
– |
| Selection of multiple processes |
– |
X |
– |
– |
| Client/server mode |
– |
– |
– |
X |
| Web server mode |
– |
– |
– |
X |
Htop delights users with a rollable process list, simple operation via function keys, and ASCII bar graphs for CPU utilization. Atop records the CPU, memory, disk, and network utilization, and colors highlight resources that are working at full capacity. Atop also records performance data and supports analysis with reporting functions or even interactive post-processing.
The newcomer Glances displays as much information as possible on a terminal with 80 characters and 24 rows. Glances also offers the ability to monitor remote systems by running in server mode over the network. Color highlights illuminate resource bottlenecks.
All tools divide the output into two areas: One area displays general system information (CPU, memory, storage, network); the other is a process list. Glances additionally logs the last resource bottlenecks in a small area.
You can configure the list of fields in Top and Htop. However, Atop and Glances only let you hide or restrict certain information. In small windows, both automatically omit some columns. To see all the information, you need to enlarge the window until additional information stops appearing.
Top
The unpretentious but powerful Top is preinstalled on all Linux systems. The fork offers some additional comfort: For example, you can use the arrow keys to scroll through the process list. When you do so, the program also updates the general area; this means that the display can be a little fidgety during scrolling.
Top's header area shows the uptime, the number of users, the load average, the number of processes, and various details relating to the CPU (see the "Key Metrics" box). If you want to see the values for the processor cores separately, press 1. The process list shows the process ID (PID), the user (USER), priority (PR and NI), memory usage (VIRT, RES, and SHR), process state (S, Table 2), percent CPU and memory usage (%CPU and %MEM), the CPU time the process has used so far, and the process name. (See the "Generating Stress" box for more information.)
Generating Stress
System monitoring tools are obviously useful for analyzing resource utilization. The stress program [10] lets you generate load for analysis purposes depending on your needs. Packages are available on Debian-based distributions, as well as from the Server Monitoring project for SUSE, Red Hat, and CentOS. Alternatively, you can compile the program from sources using the typical three steps: ./configure, make, and sudo make install.
The stress command is also suitable for testing how stable a system is under constant load. Please note, however, that tests like this can damage the hardware if your system experiences cooling problems. In case of doubt, you can use watch -d sensors or watch -d acpi -t to monitor the system temperature and immediately cancel the test if you see any sign of problems.
The stress -c 1 command fully loads a processor core by instructing it to compute square roots. The stress -d 2 command starts two threads that generate enough I/O load to keep even today's powerful computer systems busy. The program allows arbitrary combinations of different types of load. To be on the safe side, use -t to enter a time limit, after which the program automatically terminates.
Table 2
Process States
| Abbreviation | Status | Meaning |
|---|---|---|
| D |
Delay |
The process is sleeping, waiting in a system call without the ability to interrupt, typically for an I/O request. ps aux | grep "[D]" shows which processes are affected for wait I/O. |
| R |
Running |
The process is running or was just running. |
| S |
Sleeping |
The process is sleeping, waiting without the ability to interrupt – for example, for a response to a network request, a request from another process, or user input. |
| T |
Traced |
The process has been stopped – for example, to step through it with a debugger. |
| Z |
Zombie |
The process has terminated, and the kernel is still waiting for the parent process to pick up its return value. |
Key Metrics
Metrics such as CPU utilization as a percentage are relatively easy to understand; others need some explanation.
The average load means the number of processes that were executable or were waiting without the ability to interrupt them. Uninterruptable processes mainly wait for I/O requests. This metric does not act as a measure of CPU usage but only provides an indication of resulting latency depending on the number of processors. You therefore need to consider this information in connection with the CPU and the wait I/O.
CPU load is utilization by kernel (sy) and user processes (us) and, above all, the wait I/O (wa). Wait I/O is the time during which the process scheduler cannot run any processes, because all fundamentally executable processes are waiting for I/O requests.
The memory load describes the virtual address space, the virtual memory size (VIRT or VSZ), and the physically occupied memory – the resident set size (RES or RSS). The virtual address space is not very important because many processes do not use it fully. The physical memory is of greater interest, but this metric includes memory shared with other processes, such as open libraries. Top (and Htop) display these as shared memory (SHR); the value only relates to resident memory.
For paging, Top, Htop, and Atop display the minor and major page faults where needed. A major page fault occurs when a process on an x86 system accesses a 4096-byte memory page that does not yet exist in RAM. The kernel needs to load it from the disk. In the case of a minor page fault, the page is already in the cache.
In addition to the pure I/O throughput, the number of read and write operations is interesting for input and output. Only Atop shows this in the header section's DSK rows as read and write. Together with the average size of the requests (KiB/r and KiB/w), these are indicative of random access patterns that are difficult for hard disks to handle.
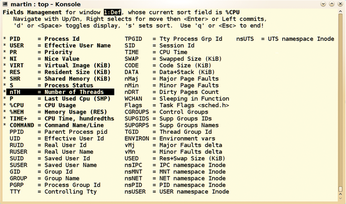
You can set which fields to display with the f key, which opens the Fields Management view (Figure 1). Top displays the fields in bold and marked with an asterisk in the process list. Pressing the spacebar adds a field to the display or removes it. You can select a field to move with the right arrow, and move it with the up or down arrows (Figure 1). The detailed man page for Top explains each field under FIELDS/Columns.
Top does not record the amount of data a process writes to disk or reads from disk. The WCHAN field is ideal for professionals who want to know in which kernel function a process is currently sleeping: It allows conclusions to be drawn on what a process is waiting for. Recent versions even offer fields for namespaces, as used for Linux containers.
The sort field is set by pressing s in the Fields Management view and is the first row in the list (see the "Setting Fields" box). If you select %MEM here, Top sorts the processes by their physical memory consumption. This can be done in the main view by pressing M, whereas C switches back to sorting by CPU usage, and T tells Top to sort by CPU time usage.
Setting Fields
Besides setting the fields for Top, you can also set them for the ps command from the same package. For example,
ps -eo pid,cmd,psr,pcpu,wchan
shows the PID and process name, as well as the processor on which the process last ran, the process's CPU usage, and the kernel function for which the process is waiting. Please refer to the ps man page for details.
Pressing r ("renice") changes the "nice" value of a process, which determines its priority. A lower nice value means a high priority. Possible values range from -20 to 19. To do this, you must specify the process ID (PID) and the signal number. Because the process order constantly changes to reflect the CPU utilization in this view, it is difficult to read the PID of a process from the table given a default refresh interval of three seconds. Pressing d or s sets a different interval, for example, 10 seconds. You can also send a signal to the process with k ("kill," see Table 3). Without further instructions, Top sends the signal SIGTERM, which instructs the process to exit.
Table 3
Signals
| Signal | Value | Description | Meaning |
|---|---|---|---|
| SIGHUP |
1 |
Hang up |
Originally: Modem hang up. Today: Tell the daemon to reload the configuration. |
| SIGKILL |
9 |
Kill |
Terminate a process in an unfriendly way. The process has no opportunity to save data. |
| SIGSEGV |
11 |
Segmentation violation |
Sent by the kernel if a process accesses a memory area that does not belong to it. |
| SIGCONT |
18 |
Continue |
Continues a paused process. |
| SIGSTOP |
19 |
Stop |
Pauses the process (say, for tracing). Continue with SIGCONT. |
| SIGTERM |
15 |
Terminate |
Terminate a process in a friendly way. |
For other interesting options, press h or see the man page. For example, when you press H, Top shows you all user threads individually. L tells Top to select a search term in the process or user list. The program also supports powerful filters: Pressing u lets you filter by users, and o, by arbitrary criteria. For example, pressing o then entering COMMAND = mysql filters for all processes with MySQL in their names. Entering %MEM>3.0 would list all processes that consume more than three percent RAM. Note that the commands are case sensitive. Additionally, Top always uses character-based comparisons. An exclamation mark negates a condition.
Top can also use colors, as evidenced when you press z. The color scheme can be determined by pressing Z. A tree view of the processes is shown when you press V. To see each processor individually instead of the single-line CPU overview, press 1. Pressing x highlights the column with the sort field. A tells Top to show even more process lists ("windows" in Top-speak) at the same time. You can try the following key sequence to admire Top in all its colorful splendor: A followed three times by z, x, a, followed by z, x (Figure 2). For more details, see COMMANDS for Windows in the man page.
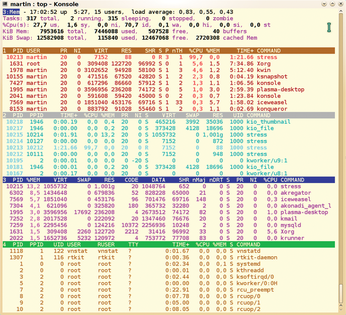 Figure 2: Top can be very colorful: A stress command fully loads a CPU, and another occupies 1GB of physical memory, as the memory view with the blue title bar shows.
If you want to see just one of the predefined field groups, press g to toggle between the different groups. Alternatively, you can press "-" to close the views that you don't need and keep only those for CPU and memory usage, for example.
To avoid the need to customize Top every time you launch it, press W to save the current configuration in the ~/.toprc file. If you want to have a little fun, on top of all of these options, take a look at the section called STUPID TRICKS Sampler in the Top man page.
Htop
The Htop program is largely similar to Top. However, you can use the arrow keys to scroll the view vertically and horizontally. Otherwise, Htop essentially relies on the function keys for control in typical Midnight Commander style. The bottom row shows a reference.
In the two-column header, Htop shows an ASCII bar (Figure 3) on the left with the CPU utilization per processor core, followed by the main memory usage and the swap allocation. The help feature, which you can open by pressing h, shows you the color mapping: For example, in CPU load, blue stands for reduced priority via nice value, green for "normal" user processes, and red for kernel threads. In the memory bar, green shows memory in use, blue is the block device buffer, and yellow is cache memory. The number of processes, the average load, and uptime are shown on the right side. Htop shows information similar to Top in the process list.
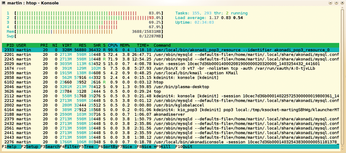 Figure 3: Htop clearly shows the extent to which Kdepim from KDE SC 4.13.2 and the current developer version generates load on the system when retrieving a couple of email messages from POP3 accounts.
To send a signal to a process, press F9. Unlike Top, you do not need to specify the PID here: Htop targets the process currently selected and color highlighted in the list. F7 and F8 reduce and increase the nice value of the process. However, Htop changes the currently selected process when you update the list – unless you press F to follow the process in the view. Alternatively, you can select the process with the spacebar to work around this behavior. In contrast to Top, Htop can work with multiple processes after you select all the target processes. U tells Htop to clear the selection.
F3 searches for processes. F4 permanently filters the list for processes with a specific name, and u filters for users. Htop also displays threads by default. For example, a MySQL server appears with all its threads in the list. To tell Htop to toggle between the sorted view and a tree view, press F5. To sort on another field, press F6; if Htop is currently in the tree view, F6 unfolds or folds a subtree. Htop also supports C, M, and T for sorting by CPU load, memory usage, and CPU time.
Permanent changes to settings – Htop writes them to the ~/.config/htop/htoprc file – are set by pressing F2 (Figure 4). You also choose here which metrics (Meters) Htop shows in the header of the view. For example, in Display options, you can choose Hide userland threads to hide user threads or disable Hide kernel threads to display the kernel threads as well. You can also use the K and H shortcuts for this. Below Colors, you'll find various color schemes from which to choose, such as Light Terminal, which is suitable for light backgrounds. The fields in the process list are set up below Columns, as are, for example, fields for the I/O throughput caused by a process.
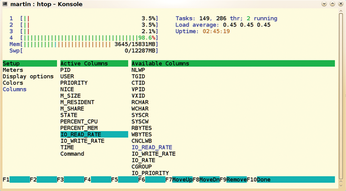 Figure 4: Htop also offers convenient configuration of the fields to be displayed in the process list.
For deeper analysis of processes, Htop has a few nice extras on board: For example, pressing s tells the program to tack the strace command onto the current process. This shows you what system functions the process calls. Pressing F8 enables automatic downward scrolling to follow the trace. L tells Htop to use the ltrace command for calls to library functions, and l returns a list of currently open files. The two aforementioned commands rely on the corresponding packages being installed.
Atop
The "AT Computing's System & Process Monitor" consists of three parts: the Top-style program, Atop, which can write to a logfile in addition to monitoring in real time; the Atopsar program, which creates reports from logs; and the Netatop service and kernel module, which lets you break down the network traffic by process.
Popular distributions include Atop; however, Debian only gives you the older 1.26 version. On SUSE, Red Hat, and CentOS the Monitoring repository provides a package for version 1.27 [6]. Choose the appropriate directory for your version of SUSE and add the URL as the package source by typing:
zypper addrepo <URL> server-monitoring
(See the "Building Atop and Netatop Yourself" box for more information.)
Building Atop and Netatop Yourself
Many distributions do not provide the current version of Atop with Netatop. This means rolling up your sleeves and building Atop and Netatop from the source code. To do so, download the current source text archives for the program, as well as the kernel module to your development directory [4]. When this issue went to press, the current versions were atop-2.0.2.tar.gz and netatop-0.3.tar.gz.
Because the compiled version of Atop ends up in /usr by default, it is not compatible with any version that exists from a previously installed Atop package. In this case, first remove the existing package from the system and then compile Atop. Atop uses the Zlib and Ncurses libraries whose developer files – in Debian-based distributions – reside in the zlib1g-dev and libncurses5-dev packages. For SUSE, the packages are called ncurses-devel and zlib-devel.
After the download, run
<C>tar-xf atop-2.0.2.tar.gz<C>
to extract the source code archive. Then, call make in the unpacked directory to compile the source code. Only the last step – installing the compiled program – needs root privileges, which you can assume by typing sudo make install. If your distribution uses Systemd as its init system, then manually copy the atop.service service file to /etc/systemd/system/multi-user.target.wants/.
The sources for the Netatop kernel module must be unzipped in the same way. To compile, you need the Linux kernel header files. You will find them – for Debian-based distributions – in the linux-headers-<version> package, whereas SUSE and Fedora use the kernel-source package. If you do not know which kernel version you are using, you can find out by typing uname -r.
You can then compile the source code for the small Netatop kernel module with make and proceed to install by running sudo make install as root. In the last step, you need to load the new Netatop along with the new kernel module by typing service netatop start. If you later no longer require the Netatop module, you can remove it from the kernel at any time by calling modprobe -r netatop. If you want to view the network traffic per process without the kernel module, take a look on the NetHogs program [7].
Atop shows information about processes, the processor load, memory plus swap, mass storage devices, and the network in the header area (Figure 5). It color-highlights resources working at high load; thus, you can see at a glance where bottlenecks are occurring. The configurable limits in the ~/.atoprc file are explained by the man page in the COLORS section. Atop also leaves out uninteresting information about unused resources or sleeping processes. Pressing a reveals all processes, however.
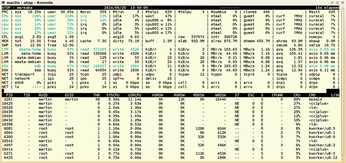 Figure 5: Atop monitoring the Kdepim build process. You can see some load on the CPU and the mSATA SSD. A MySQL instance belonging to Akonadi, which supplies information to Kdepim, also needs a fair amount of CPU performance.
Atop provides numerous additional details compared with Top. For example, the Paging Frequency (PAG) line provides information on the extent to which the kernel is searching for free pages or swapping out. It also provides some information on disk I/O and network traffic. Additionally, Atop takes into account the pro rata resource usage by processes that terminate during the sample interval, relying on the process accounting kernel function to do so. The kernel writes to an accounting file. You should thus never terminate Atop with SIGKILL, because it cannot otherwise stop the accounting process. Atop tags processes that terminate within the sampling with angle brackets.
The generic view (accessible by pressing g) of the process list includes information such as the PID, system and user CPU utilization, physical and virtual address space, and data read and written. VGROW and RGROW state how much additional address space the process has requested. This information is often more interesting than the absolute values.
Atop also supports other views: m shows main memory usage with minor and major page faults, the absolute physical and virtual address space, and percent memory usage. In this view, you can see the volume of data that is read and written, and the data to be written that the kernel didn't write because the process deleted it prior to this action (in WRDSK_CANCEL). In conjunction with Netatop, Atop shows a network usage list [6] when you press n.
Depending on the view, Atop sorts the process list by CPU, main memory, mass storage, or network utilization as a percentage. Keyboard shortcuts control the sort order regardless of the view. Note that you can sort by the most used resource by pressing A. Atop shows at a glance to what extent processes utilize the most heavily used resource – the bottleneck.
Buy this article as PDF
(incl. VAT)
Buy Linux Magazine
Subscribe to our Linux Newsletters
Find Linux and Open Source Jobs
Subscribe to our ADMIN Newsletters
Support Our Work
Linux Magazine content is made possible with support from readers like you. Please consider contributing when you’ve found an article to be beneficial.

News
-
Fedora Asahi Remix 41 Available for Apple Silicon
If you have an Apple Silicon Mac and you're hoping to install Fedora, you're in luck because the latest release supports the M1 and M2 chips.
-
Systemd Fixes Bug While Facing New Challenger in GNU Shepherd
The systemd developers have fixed a really nasty bug amid the release of the new GNU Shepherd init system.
-
AlmaLinux 10.0 Beta Released
The AlmaLinux OS Foundation has announced the availability of AlmaLinux 10.0 Beta ("Purple Lion") for all supported devices with significant changes.
-
Gnome 47.2 Now Available
Gnome 47.2 is now available for general use but don't expect much in the way of newness, as this is all about improvements and bug fixes.
-
Latest Cinnamon Desktop Releases with a Bold New Look
Just in time for the holidays, the developer of the Cinnamon desktop has shipped a new release to help spice up your eggnog with new features and a new look.
-
Armbian 24.11 Released with Expanded Hardware Support
If you've been waiting for Armbian to support OrangePi 5 Max and Radxa ROCK 5B+, the wait is over.
-
SUSE Renames Several Products for Better Name Recognition
SUSE has been a very powerful player in the European market, but it knows it must branch out to gain serious traction. Will a name change do the trick?
-
ESET Discovers New Linux Malware
WolfsBane is an all-in-one malware that has hit the Linux operating system and includes a dropper, a launcher, and a backdoor.
-
New Linux Kernel Patch Allows Forcing a CPU Mitigation
Even when CPU mitigations can consume precious CPU cycles, it might not be a bad idea to allow users to enable them, even if your machine isn't vulnerable.
-
Red Hat Enterprise Linux 9.5 Released
Notify your friends, loved ones, and colleagues that the latest version of RHEL is available with plenty of enhancements.

