
Python network data visualization
DNS Data
If you modify the previous code slightly, you can print DNS lookups. Instead of pkt[IP].src, you use pkt.haslayer(DNS). Again, you create an empty list and append to it; then use Scapy to check for DNS and affirm that the packet is a query (with as the QR type) and not a response, which would have a 1 in the QR field. (Listing 4). Again, count and print (Figure 3).
Listing 4
DNS Lookups
01 from scapy.all import *
02 from collections import Counter
03 import plotly
04
05 packets = rdpcap("example.pcap")
06
07 lookups=[]
08 for pkt in packets:
09   if IP in pkt:
10     try:
11       if pkt.haslayer(DNS) and pkt.getlayer(DNS).qr == 0:
12         lookup=(pkt.getlayer(DNS).qd.qname).decode("utf-8")
13         lookups.append(lookup)
14     except:
15       pass
16
17 cnt=Counter()
18 for lookup in lookups:
19   cnt[lookup] += 1
20
21 xData=[]
22 yData=[]
23
24 for lookup, count in cnt.most_common():
25   xData.append(lookup)
26   yData.append(count)
27
28 plotly.offline.plot({
29   "data":[plotly.graph_objs.Bar(x=xData, y=yData)] })
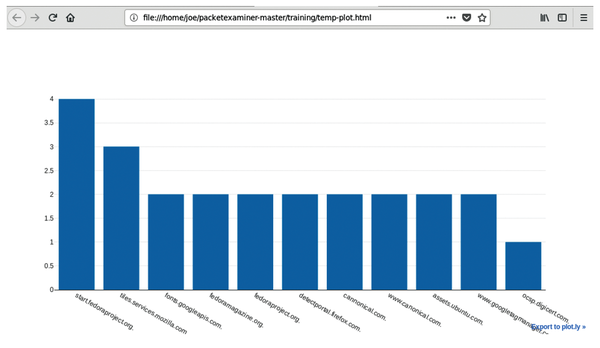 Figure 3: Graph of DNS lookups.
Packets Through Time
At first glance, plotting packets over time is an easy problem to solve. Just grab the packet and use pkt[IP].len; however, if you have a reasonable data collection, you will almost always print data of 1500 bytes (the default MTU in most routers), which produces an uninteresting graph. With the pandas Python data analysis library, you can make human-readable dates from the packets, which are in epoch (unix time) and then bin the date and time. (Listing 5). First, you have to install pandas:
sudo pip3 install pandas
Listing 5
Using the pandas Library
01 from scapy.all import *
02 import plotly
03 from datetime import datetime
04 import pandas as pd
05
06 #Read the packets from file
07 packets = rdpcap('example.pcap')
08
09 #Lists to hold packet info
10 pktBytes=[]
11 pktTimes=[]
12
13 #Read each packet and append to the lists.
14 for pkt in packets:
15   if IP in pkt:
16     try:
17       pktBytes.append(pkt[IP].len)
18
19       #First we need to covert Epoch time to a datetime
20       pktTime=datetime.fromtimestamp(pkt.time)
21       #Then convert to a format we like
22       pktTimes.append(pktTime.strftime("%Y-%m-%d %H:%M:%S.%f"))
23
24     except:
25       pass
26
27 #This converts list to series
28 bytes = pd.Series(pktBytes).astype(int)
29
30 #Convert the timestamp list to a pd date_time
31 times = pd.to_datetime(pd.Series(pktTimes).astype(str), errors='coerce')
32
33 #Create the dataframe
34 df = pd.DataFrame({"Bytes": bytes, "Times":times})
35
36 #set the date from a range to an timestamp
37 df = df.set_index('Times')
38
39 #Create a new dataframe of 2 second sums to pass to plotly
40 df2=df.resample('2S').sum()
41 print(df2)
42
43 #Create the graph
44 plotly.offline.plot({
45   "data":[plotly.graph_objs.Scatter(x=df2.index, y=df2['Bytes'])],
46   "layout":plotly.graph_objs.Layout(title="Bytes over Time ",
47     xaxis=dict(title="Time"),
48     yaxis=dict(title="Bytes"))})
As before, you create lists to hold data (lines 10-11) and, this time, store the length of bytes in a packet and the timestamp of the packet. Next, you will get the length of the packet with (pkt[IP].len) and convert the time using datetime (lines 13-25). With the pandas library, you convert the list to a pandas series and then convert to a timestamp, create the pandas dataframe, and organize the data in to two-second bins (lines 21-41). Now you can use Plotly to print the chart. Lines 46-48 add a title with graph_objs.Layout. The time (x) axis was created during resampling, with the y axis data in bytes (Figure 4).
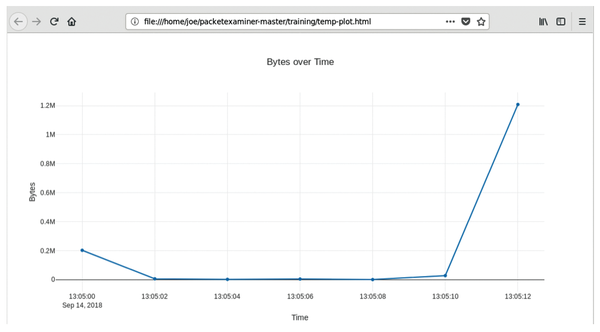 Figure 4: Flow of packets over time.
Conclusion
You can do much more with Scapy, such as grab URLs, pull files from PCAPs, and more; by slightly modifying the examples in this article, you can add more features. The open source PacketExaminer project offers a pre-made harness for PCAP analysis [2], and all of the code in these examples can be found in the training folder of the repo. If you have any questions, just let me know at joe.mcmanus@canonical.com.
Infos
- Scapy: https://scapy.net
- PacketExaminer project on GitHub: https://github.com/joemcmanus/packetexaminer
« Previous 1 2
Buy this article as PDF
(incl. VAT)
Buy Linux Magazine
US / Canada
UK / Australia
Subscribe to our Linux Newsletters
Find Linux and Open Source Jobs
Subscribe to our ADMIN Newsletters
Support Our Work
Linux Magazine content is made possible with support from readers like you. Please consider contributing when you’ve found an article to be beneficial.

News
-
Endless OS 6 has Arrived
After more than a year since the last update, the latest release of Endless OS is now available for general usage.
-
Fedora Asahi 40 Remix Available for Macs with Apple Silicon
If you've been anticipating KDE's Plasma 6 for your Apple Silicon-powered Mac, then you're in luck.
-
Red Hat Adds New Deployment Option for Enterprise Linux Platforms
Red Hat has re-imagined enterprise Linux for an AI future with Image Mode.
-
OSJH and LPI Release 2024 Open Source Pros Job Survey Results
See what open source professionals look for in a new role.
-
Proton 9.0-1 Released to Improve Gaming with Steam
The latest release of Proton 9 adds several improvements and fixes an issue that has been problematic for Linux users.
-
So Long Neofetch and Thanks for the Info
Today is a day that every Linux user who enjoys bragging about their system(s) will mourn, as Neofetch has come to an end.
-
Ubuntu 24.04 Comes with a “Flaw"
If you're thinking you might want to upgrade from your current Ubuntu release to the latest, there's something you might want to consider before doing so.
-
Canonical Releases Ubuntu 24.04
After a brief pause because of the XZ vulnerability, Ubuntu 24.04 is now available for install.
-
Linux Servers Targeted by Akira Ransomware
A group of bad actors who have already extorted $42 million have their sights set on the Linux platform.
-
TUXEDO Computers Unveils Linux Laptop Featuring AMD Ryzen CPU
This latest release is the first laptop to include the new CPU from Ryzen and Linux preinstalled.