Monitor Bandwidth Usage with vnStat

Productivity Sauce
In these days of bandwidth caps and pay-per-kilobyte rates, keeping an eye on your bandwidth usage makes a lot of sense. While there is no lack of bandwidth monitoring utilities, vnStat stands out from the crowd thanks to its ability to store monitoring data in a database and resume monitoring automatically on reboot. This means that once installed and configured, vnStat quietly monitors a specified network interface and saves the collected data. You can then use vnStat's command parameters to view detailed reports of your bandwidth usage.
vnStat is available in the software repositories of many mainstream Linux distributions, so you can easily install it using your distro's package manager. On an Ubuntu-based system, vnStat can be installed using the sudo apt-get install vnstat command. Before you can start using the utility, you must specify the network interface you want vnStat to monitor. First, run the ifconfig command to view a list of all available network interfaces. You can then use the -u and -i parameters to create a database for the specified network interface, for example:
sudo vnstat -u -i wlan0
Once vnstat is configured, it needs some time to collect data. After that you can view the bandwidth usage statistics using the vnstat command. The utility sports a few rather useful parameters, too. The -d ( or --days) parameter displays the daily bandwidth usage, while the -w ( --weeks) and -m ( --months) parameters break down the statistics by week and month. You can view a full list of available parameters using either the vnstat --help or vnstat --longhelp command.
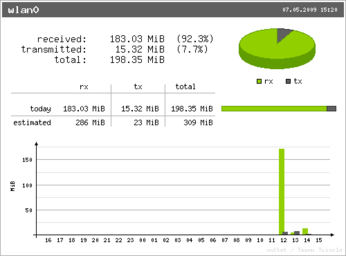
The packaged version of vnStat that is available in your distro's software repositories may not include vnStati -- a nifty utility which can turn dry text-only statistics into nice-looking graphs. In this case, if you want to analyze monitoring data visually, you have to compile vnStat from source. Fortunately, this is a rather straightforward procedure. First of all, make sure that you have all the tools necessary for building software from source. On Ubuntu, you can install them using the sudo apt-get install build-essential command. Next, install the libgd2-noxpm and libgd2-noxpm-dev libraries, using the sudo apt-get install libgd2-noxpm libgd2-noxpm-dev command. Download the latest .tar.gz version of vnStat from the project's Web site and unpack it. Switch to the resulting directory in the terminal and execute the make all command. Finally, run the sudo make install command to install the software. To generate a graph in the PNG format using VnStati, you have to specify at least three parameters: a graph type, a network interface, and the output file. For example, the command below produces a vnstat.png graphics file containing a traffic summary including hourly data using a horizontal layout:
vnstati -vs -i wlan0 -o ~/vnstat.png
Of course, you can use the vstati --help command to view a list of the available parameters.
Comments
comments powered by DisqusSubscribe to our Linux Newsletters
Find Linux and Open Source Jobs
Subscribe to our ADMIN Newsletters
Support Our Work
Linux Magazine content is made possible with support from readers like you. Please consider contributing when you’ve found an article to be beneficial.

News
-
Kali Linux Waxes Nostalgic with BackTrack Mode
For those who've used Kali Linux since its inception, the changes with the new release are sure to put a smile on your face.
-
Gnome 50 Smooths Out NVIDIA GPU Issues
Gamers rejoice, your favorite pastime just got better with Gnome 50 and NVIDIA GPUs.
-
System76 Retools Thelio Desktop
The new Thelio Mira has landed with improved performance, repairability, and front-facing ports alongside a high-quality tempered glass facade.
-
Some Linux Distros Skirt Age Verification Laws
After California introduced an age verification law recently, open source operating system developers have had to get creative with how they deal with it.
-
UN Creates Open Source Portal
In a quest to strengthen open source collaboration, the United Nations Office of Information and Communications Technology has created a new portal.
-
Latest Linux Kernel RC Contains Changes Galore
Linux kernel 7.0-rc3 includes more changes than have been made in a single release in recent history.
-
Nitrux 6.0 Now Ready to Rock Your World
The latest iteration of the Debian-based distribution includes all kinds of newness.
-
Linux Foundation Reports that Open Source Delivers Better ROI
In a report that may surprise no one in the Linux community, the Linux Foundation found that businesses are finding a 5X return on investment with open source software.
-
Keep Android Open
Google has announced that, soon, anyone looking to develop Android apps will have to first register centrally with Google.
-
Kernel 7.0 Now in Testing
Linus Torvalds has announced the first Release Candidate (RC) for the 7.x kernel is available for those who want to test it.


Additional Tools
If anyone has additional network monitoring needs, let me suggest this website: http://www.activitymonitori...network_server_monitoring1.php
great tip
was easy to install through ubuntu's apt
I am trying to configure vnstat php fontend (http://www.sqweek.com/sqweek/index.php?p=1) must have for a server