
Traffic Watch
Analyzing Network Traffic with iftop
BySluggish network connections can be nerve-wracking. Checking live statistics about network traffic can help pinpoint the problem. Iftop is a command-line system monitoring tool that can help you identify bandwidth hogs and keep traffic moving.
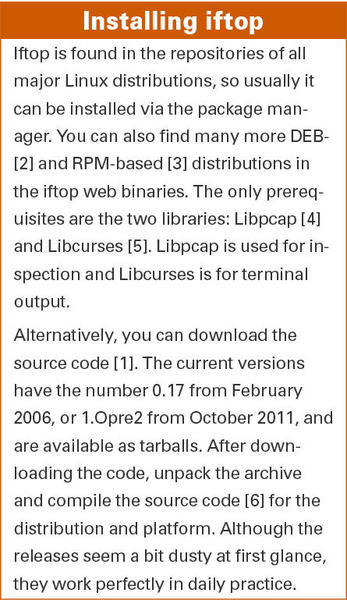
Iftop (interface top) should be a part of every Linux user’s toolbox. The program shows network usage, whereas top and htop show the current CPU load. Iftop is not usually part of the standard installation, however. (See the “Installing iftop” box).
With iftop, you can find out why bandwidth is being eaten up on a network interface. The program shows the network connections between two IP addresses and how many data packets traverse the link. Alternatively, iftop shows the connection on the protocol level, for example, all FTP or HTTP traffic. Thus, iftop is especially good at troubleshooting why a line seems particularly slow.
Getting Started
Start iftop in the terminal with the iftop command. Because the program requires administrator rights, you must be root or start it with sudo.
After startup, iftop appears in three parts: at the upper edge is the data rate scale, in the middle the active network connections, and data transfer volume statistic on the bottom (Figure 1). Iftop evaluates the data from the first external network interface it detects, unless instructed otherwise (more on this later). This interface is usually eth0.
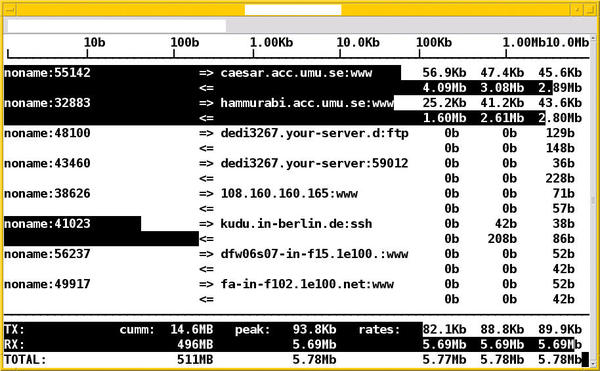 Figure 1: The iftop display shows the source without domain name but with port, and destination with domain name and protocol.
The active network connections are displayed in two lines with five columns in each. The first line is the send and the second line is the receive. A small arrow shows the direction: => is the send direction and <= is the receive direction. The columns show the source and destination of the connection along with the values for a successful data transfer. The columns on the right show the data transfer rates for the last 2, 10, and 40 seconds, respectively.
Per transmission, you’ll see a black bar that highlights the connection. The width of the bar shows the proportion of the connection to the total data transferred. In that way you can see at a glance which data stream is using the most bandwidth. With more active network connections than can fit on the screen, you can scroll through using the vim keybindings j for scrolling down and k for scrolling up.
At the bottom edge, iftop shows the transmitted TX, received RX, and TOTAL data transfers. The second column shows the cumulative values over the observed period. The three columns on the right show the cumulative progress in the previous 2, 10, and 40 seconds.
Iftop doesn’t have a lot of bells and whistles. To get an overview of options during runtime, simply press h (Figure 2). Other command help is in the comprehensive man pages; enter man iftop at the command line.
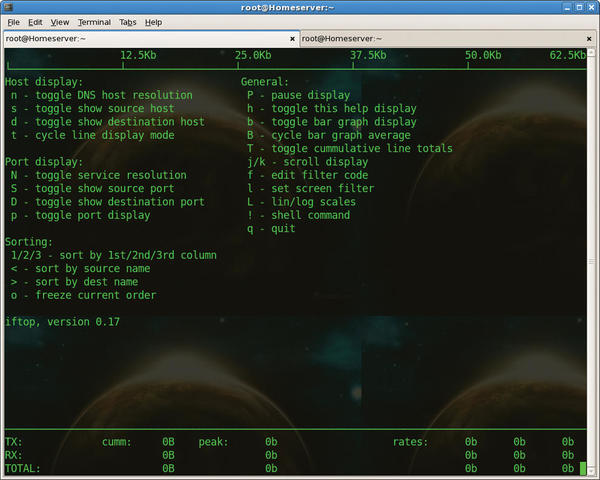 Figure 2: Pressing h brings up command help.
Customized View
You can toggle the scale for the data rate with Shift+L to linear or logarithmic mode, and iftop flashes the mode briefly in the upper left corner. Pressing b toggles the bar graph display on and off. Pressing n toggles between displaying IP addresses and resolving them into domain names via DNS.
Figure 3 shows a mixed display; some of the IP addresses can’t resolve into domain names. Also, you can see the port numbers for the connections. You can press p> to toggle the port display; Shift+S limits this action to the source ports and Shift+D to the destination ports only.
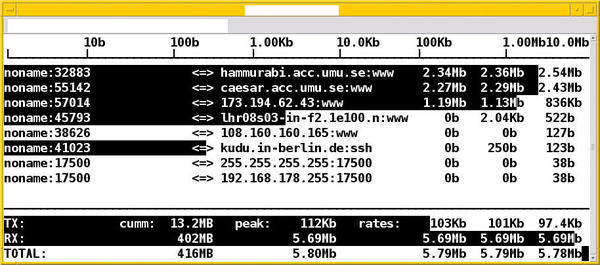 Figure 3: Compact display of the connections.
What applies to port numbers also applies to hostnames. Press s to toggle showing the source hosts and d to show the destination hosts only.
Filtering and Sorting
As you can see, iftop is quite flexible in its display characteristics. The same goes for filtering and sorting.
To view only certain network connections, set a pattern to filter the output. Press lowercase L (for limit) to open a text input box on the top line. Iftop sees this as a regular expression and shows only those connections that fit the pattern. In Figure 4, the dropbox entry sets the regular expression for finding only those connections that include the string dropbox.
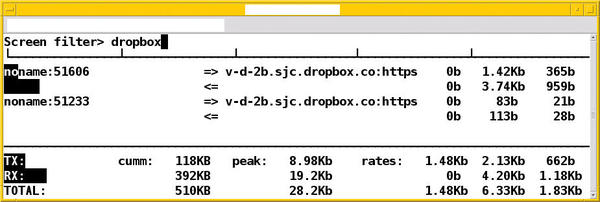 Figure 4: Filter connections using a regular expression pattern.
To sort the output, iftop provides two options. Pressing < or > sorts the output by source or destination name, respectively. 1, 2, and 3 sort by the respective time interval columns.
Call Parameters
Iftop accepts a number of parameters at startup. Many of them coincide with the aforementioned keyboard shortcuts. Curious users might be interested in the two options -i and -p. With -i (interface), you can specify which interface you want iftop to monitor. The switch -p runs iftop in promiscuous mode, which means that it also monitors traffic that doesn’t pass directly through the specified interface.
Using the -f option is a way of filtering specific packets by network, host, or port. For example, use the following to display only SSH packets that run over the /dev/wlan0 wireless interface:
# iftop -i wlan0 -f "dst port 22"
Destination port 22 is shorthand for the Secure Shell (SSH) port.
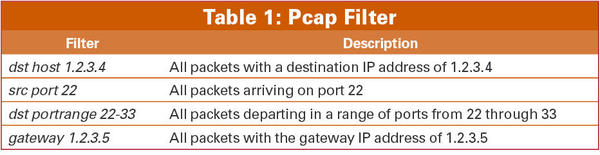
The filter expression matches the syntax for pcap-filter and allows for an elegant selection of packets. Table 1 provides some examples.
Conclusion
The iftop command-line tool captures data traffic on network interfaces and then analyzes which network connections exist and how many data packets are running on each one. In this way, you can quickly determine how much bandwidth each program and service requires and is possibly overloading. Packet filtering is just one of many options that helps.
Info
[1] Iftop: http://www.ex-parrot.com/~pdw/iftop/
[2] DEB package for Iftop: http://packages.debian.org/squeeze/iftop
[3] Finding RPMs: http://rpmfind.net
[4] Libpcap: http://www.tcpdump.org
[5] Libcurses: http://www.gnu.org/software/ncurses/ncurses.html
[6] Compiling Things on Ubuntu the Easy Way: https://help.ubuntu.com/community/CompilingEasyHowTo
Acknowledgment
The author thanks Axel Beckert for his help in preparing this article.
The Author
Frank Hofmann (http://www.efho.de/) studied computer science at the Technical University of Chemnitz, Germany. He currently works in Berlin at Buro 2.0, a network of open source experts, as a service provider specializing in printing and typesetting. Frank is also cofounder of the Wizards of FOSS training company and has coordinated meetings of the Linux User Group in the Berlin-Brandenburg region since 2008.
Subscribe to our Linux Newsletters
Find Linux and Open Source Jobs
Subscribe to our ADMIN Newsletters
Support Our Work
Linux Magazine content is made possible with support from readers like you. Please consider contributing when you’ve found an article to be beneficial.

News
-
Kali Linux Waxes Nostalgic with BackTrack Mode
For those who've used Kali Linux since its inception, the changes with the new release are sure to put a smile on your face.
-
Gnome 50 Smooths Out NVIDIA GPU Issues
Gamers rejoice, your favorite pastime just got better with Gnome 50 and NVIDIA GPUs.
-
System76 Retools Thelio Desktop
The new Thelio Mira has landed with improved performance, repairability, and front-facing ports alongside a high-quality tempered glass facade.
-
Some Linux Distros Skirt Age Verification Laws
After California introduced an age verification law recently, open source operating system developers have had to get creative with how they deal with it.
-
UN Creates Open Source Portal
In a quest to strengthen open source collaboration, the United Nations Office of Information and Communications Technology has created a new portal.
-
Latest Linux Kernel RC Contains Changes Galore
Linux kernel 7.0-rc3 includes more changes than have been made in a single release in recent history.
-
Nitrux 6.0 Now Ready to Rock Your World
The latest iteration of the Debian-based distribution includes all kinds of newness.
-
Linux Foundation Reports that Open Source Delivers Better ROI
In a report that may surprise no one in the Linux community, the Linux Foundation found that businesses are finding a 5X return on investment with open source software.
-
Keep Android Open
Google has announced that, soon, anyone looking to develop Android apps will have to first register centrally with Google.
-
Kernel 7.0 Now in Testing
Linus Torvalds has announced the first Release Candidate (RC) for the 7.x kernel is available for those who want to test it.