
Monitor resource contention with Pressure Stall Information
Pressure Gauge

Pressure Stall Information (PSI) is a new feature that gives users a better view of resource contention.
CPU, RAM, and I/O are the three most important computing resources. If these resources are depleted, processes start to fight for them and resource contention scenarios occur. To avoid these problems, it makes sense to monitor precisely what resources applications use in order to correctly dimension the hardware requirements and make optimal use of the existing hardware.
Smartphones can also benefit from this type of monitoring: when resources become scarce, phones often terminate programs in the background in order to offer the foreground application sufficient resources.
Load Average
Most administrators keep an eye on the load average to determine the extent to which a system is exposed to load. The uptime or top (Listing 1) commands both display the load average, reading the values from the /proc/loadavg file. The file contains five values (Line 6). In addition to the three load average values, the fourth value counts the current executable kernel scheduling entities and the fifth shows the process ID of the latest process created.
Listing 1
Load Average
01 $ strace -e file uptime
02 [...]
03 openat(AT_FDCWD, "/proc/loadavg", O_RDONLY) = 4
04 16:17:55 up 3 days, 3:27, 1 user,  load average: 0,44, 0,78, 0,64
05 $ more /proc/loadavg
06 0.12 0.26 0.36 2/909 130726
The first three values state the load average for the executable processes, that is, the number of processes with a status of R (for runnable) that are waiting for CPU cycles and those with a status of D (for disk sleep) that are waiting for I/O. The three values show the load average for a period of 1, 5, and 15 minutes.
Few admins actually understand these values, and even the kernel developers don't actually think too much of them (Figure 1) [1].
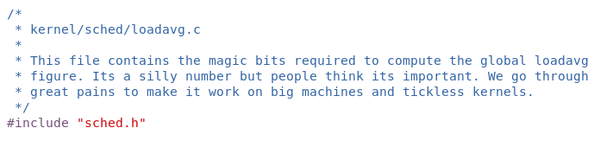 Figure 1: Comment by Linux scheduler maintainer Peter Zijlstra on loadavg.c.
The brief summary of their findings is: the load average is not useful when it comes to assessing system utilization. The admin can, at most, use the three values to estimate whether a reported performance problem has already been solved because the values become smaller again. However, computing the load average has other disadvantages:
- The admin has to interpret the values relative to the number of threads and CPUs. A value of 128 can be completely acceptable on a 128-thread system. On a 4-threaded system, however, probably nothing will work.
- The value does not tell you how long a process had to wait for resources.
- CPU and I/O are related, which makes it impossible to examine CPU and I/O requirements separately.
- Because the minimum resolution is one minute, the load cannot be observed in real time.
These problems make the load average unsuitable as a metric for admins who need to react quickly to performance events.
PSI
To better identify resource conflicts, and to make it easier to manage overloaded systems at Facebook's data centers, Facebook's kernel team developed Pressure Stall Information (PSI). According to the project's website [2], PSI is a canonical new way to obtain utilization metrics for memory, CPUs, and I/O via the Linux kernel.
Linus Torvalds published the 2018 implementation by Johannes Weiner in Linux 4.20. Weiner is also listed as the PSI maintainer [3]. In Debian 10 "Buster," this functionality is not yet included, but it can be found in Ubuntu from version 19.04 with a Linux kernel as of version 5.0.
Like other common kernel parameters, PSI values are accessed through the /proc pseudo-filesystem, which acts as an interface to kernel data structures. PSI values appear in three different files within the /proc/pressure directory:
cpu– information related to CPU utilizationmemory– information on the time processes spend waiting due to memory issuesio– information on the time spent waiting for I/O
Though the three files offer slightly different data, they are organized in a similar way.
CPU
The /proc/pressure/cpu file contains four values: avg10, avg60, avg300, and total (Listing 2, Line 2). The values starting with avg* represent the percentage of processes in the last 10, 60, and 300 seconds that had to wait for CPU resources.
Listing 2
Measuring with cpu
01 $ more /proc/pressure/cpu
02 some avg10=0.02 avg60=0.05 avg300=0.02 total=3990454056
03 [...]
04 $ watch -n ,1 grep -R . /proc/pressure/cpu
05 Every 0.1s: grep -R . /proc/pressure/cpu   machine: Mon Jun  8 17:54:34 2020
06 some avg10=0.00 avg60=0.00 avg300=1.07 total=2684388193
Suppose two processes each occupy 100 percent of one thread and run for five minutes on a two-threaded system where nothing else is running. In this case, all three averages are zero, of course, because the processes didn't have to wait. The fact that PSI delivers accuracy to within 10 seconds is an important benefit, because you can react 50 seconds earlier than with the load average.
The last value, total, also makes a big difference: the total value specifies the total time in microseconds for which processes had no CPU resources available. You can read this value at any time – about every 500 milliseconds. The difference between two successive values is the number of microseconds in this time interval in which processes had to wait for CPU resources.
This kind of granular resolution was not available previously in the Linux kernel. Thanks to watch, you can see how the value increases in realtime (Listing 2, Lines 4 to 6), which means you can monitor resource bottlenecks in realtime and, if necessary, kill unimportant processes or migrate them to other systems.
Buy this article as PDF
(incl. VAT)
Buy Linux Magazine
US / Canada
UK / Australia
Subscribe to our Linux Newsletters
Find Linux and Open Source Jobs
Subscribe to our ADMIN Newsletters
Support Our Work
Linux Magazine content is made possible with support from readers like you. Please consider contributing when you’ve found an article to be beneficial.

News
-
Red Hat Adds New Deployment Option for Enterprise Linux Platforms
Red Hat has re-imagined enterprise Linux for an AI future with Image Mode.
-
OSJH and LPI Release 2024 Open Source Pros Job Survey Results
See what open source professionals look for in a new role.
-
Proton 9.0-1 Released to Improve Gaming with Steam
The latest release of Proton 9 adds several improvements and fixes an issue that has been problematic for Linux users.
-
So Long Neofetch and Thanks for the Info
Today is a day that every Linux user who enjoys bragging about their system(s) will mourn, as Neofetch has come to an end.
-
Ubuntu 24.04 Comes with a “Flaw"
If you're thinking you might want to upgrade from your current Ubuntu release to the latest, there's something you might want to consider before doing so.
-
Canonical Releases Ubuntu 24.04
After a brief pause because of the XZ vulnerability, Ubuntu 24.04 is now available for install.
-
Linux Servers Targeted by Akira Ransomware
A group of bad actors who have already extorted $42 million have their sights set on the Linux platform.
-
TUXEDO Computers Unveils Linux Laptop Featuring AMD Ryzen CPU
This latest release is the first laptop to include the new CPU from Ryzen and Linux preinstalled.
-
XZ Gets the All-Clear
The back door xz vulnerability has been officially reverted for Fedora 40 and versions 38 and 39 were never affected.
-
Canonical Collaborates with Qualcomm on New Venture
This new joint effort is geared toward bringing Ubuntu and Ubuntu Core to Qualcomm-powered devices.