Monitor your old Linux devices
Watching Grampa
Create monitoring dashboards with SSH, command-line tools, and Node-RED.
Some excellent technologies and packages are available for monitoring computer hardware. For medium to large systems, the Simple Network Monitoring Protocol (SNMP) approach is usually the preferred solution. However if you have a smaller system with older or low-end servers, some excellent lightweight command-line monitoring utilities can be used instead.
These command-line utilities can be run remotely over Secure Shell (SSH) and the output parsed to return only the key data values, which can then be displayed graphically in a Node-RED web dashboard (Figure 1). In this article, I demonstrate examples that use the iostat
utility [1] to monitor CPU utilization and the lm-sensors package [2] and hddtemp
utility [3] to monitor temperatures on dashboards.
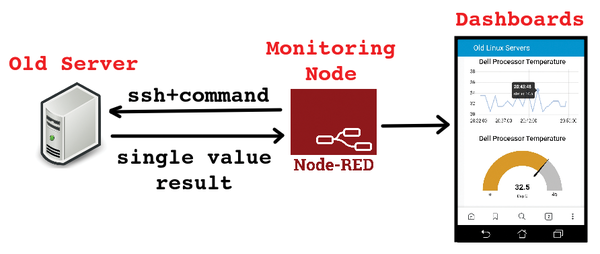
CPU Utilitization
The iostat
utility is part of the sysstat package and is probably already loaded on your older systems. If not, it can be installed by:
sudo apt-get install sysstat
The iostat
utility generates a report for CPU, device, and filesystem utilization. The output from this command can be parsed with some Bash statement to return just the key value of interest.
Listing 1 shows an example of how to grab the fourth line of output with sed (line 7) and parse the %idle value at the end of the line with awk (line 11) to get the sixth string item (line 12).
Listing 1
Parsing iostat Output
01 pete@lubuntu: ~$ iostat -c 02 Linux 4.15.0-72-generic (lubuntu) 2020-05-02 i686 (4 CPU) 03 avg-cpu: %user %nice %system %iowait %steal %idle 04 8.37 0.03 3.33 1.29 86.97 05 06 # Get 4th line of the iostat output 07 pete@lubuntu : ~$ iostat -c | sed -n 4p 08 8.36 0.03 3.33 1.29 0.00 86.99 09 10 # Now get the 6th string 11 pete@lubuntu : ~$ iostat -c | sed -n 4p | awk '{print $6}' 12 87.02
Chip-Based Temperature
To install the hardware sensors in the lm-sensors package, enter:
sudo apt-get install lm-sensors
After the package is installed, the software needs to detect which sensors are available for monitoring:
sudo sensors-detect
This step presents a number of prompts about which sensors need to be scanned. Once the scan step is complete, the sensors command returns results for all the hardware it found.
Specific sensors can be shown with the command:
sensors <chip name>
Listing 2 shows an example of the sensors
command being used to look at the dell_smm-virtual-0 chipset. The CPU temperature value (in line 5) can be parsed with grep
(line 10), which looks for the line that contains "CPU'; then, awk (line 14) outputs the second item of the string (line 15).
Listing 2
Parsing Sensor Data
01 pete@lubuntu: ~$ sensors dell_smm-virtual-0 02 dell_smm-virtual-0 03 Adapter: Virtual device 04 Processor Fan: 2687 RPM 05 CPU: +40.0°C 06 Ambient: +34.0°C 07 SODIMM: +33.0°C 08 09 # Get the CPU temperature 10 pete@lubuntu: ~$ sensors dell_smm-virtual-0 | grep 'CPU' 11 CPU: +40.0°C 12 13 # Return just the temperature 14 pete@lubuntu: ~$ sensors dell_smm-virtual-0 | grep 'CPU' | awk '{print $2}' 15 +40.0°C
Hard Drive Temperature
The hddtemp hard drive temperature monitoring package is installed with:
sudo apt-get install hddtemp
By default, hddtemp requires superuser rights, so to make the results available to non-superusers use:
sudo chmod u+s /usr/sbin/hddtemp
To see the temperature of a hard drive, enter its device name. For example, to see /dev/sda
, use:
$ hddtemp /dev/sda /dev/sda: WDC WD3200BPVT-75JJ5T0: 34°C
Again, you can use the awk
command to parse the output to get just the temperature. For this example, the temperature is the fourth item of the string, so the command displays that value as shown here:
$ hddtemp /dev/sda | awk '{print $4}' 34°C
Remote Commands
Rather than having remote Linux servers send data to a central monitoring node, the central node can periodically poll the remote servers for data.
SSH can be used to run remote commands; however, SSH needs you to enter a password. Although this is fine for manual testing, for automated polling it is a problem. Two solutions to this problem are:
ssh-keygen
, which generates an SSH key pair that is stored in a user directory, enabling the standard SSH client to run without you having to enter a password.sshpass
, which is an SSH client that includes the username/password as a command-line option.
The ssh-keygen
approach is recommended for most applications because it does not expose passwords. For testing, I use the sshpass
method, and in the Node-RED project that follows, I use the ssh-keygen
approach. The sshpass
command is included in many standard distributions. To install it, enter:
sudo apt-get install sshpass
Listing 3 shows how to get CPU (line 1) and hard drive (line 13) temperatures.
Listing 3
CPU and Hard Drive Temps
01 $ sshpass -p mypassword ssh username@192.168.0.116 sensors 02 dell_smm-virtual-0 03 Adapter: Virtual device 04 Processor Fan: 3044 RPM 05 CPU: +31.0°C 06 Ambient: +33.0°C 07 SODIMM: +33.0°C 08 09 acpitz-virtual-0 10 Adapter: Virtual device 11 temp1: +51.5°C (crit = +107.0°C) 12 13 $ sshpass -p mypassword ssh username@192.168.0.116 hddtemp /dev/sda 14 /dev/sda: HTS548040M9AT00: 39°C
As you saw earlier, grep
and awk
calls can be used to show just the required values for the CPU:
$ sshpass -p mypassword ssh username@192.168.0.116 sensors | grep temp1 | awk '{print $2}' +30.5°C
and for the hard drive:
$ sshpass -p mypassword ssh username@192.168.0.116 hddtemp /dev/sda | awk '{print $3}' 39°C
At this point, a mechanism is available to get key monitoring values from remote Linux nodes. The next step is to pass these values to a Node-RED dashboard.
Node-RED Dashboard
Node-RED [4] is a web-based visual programming environment with a wide variety of nodes that can be wired together to create logic. On the Raspberry Pi platform, Node-RED is pre-installed in Raspbian images. To install Node-RED on other systems see the Get Started docs [5].
For this project I installed two nodes: bigssh, an SSH node that saves and uses ssh-keygen
credentials, and bigtimer, a timer node that schedules data polling. These components can be installed either manually or with the Manage palette menu option (Figure 2).
A basic test circuit to poll a Linux server manually and return a temperature would use an Inject, a bigssh, and a Debug node (Figure 3). The Inject node is used to pulse the logic.
By double-clicking on the bigssh node, an Edit configuration window opens. In the myssh field, you enter the username, host, and ssh-keygen
password. The bigssh node passes its first output (commandLine) to a Debug node. The Debug node sends message and payload information to the Debug tab. If the Debug node does not show the expected SSH command result, then the bigssh third output (minError) shows the error output.
After I was able to get all my SSH commands working successfully in the test logic, I changed the logic to use a bigtimer node for scheduling and some dashboard nodes for display (Figure 4). The bigtimer node has a good selection of scheduling and timing functions. Of the three Big Timer outputs, the middle output pin generates a pulse every minute.
You have the choice of a number of dashboard presentations. For a simple first pass, I used gauge and chart nodes. Double-click on each of these dashboard nodes to edit properties like labels and scales.
After the logic is complete, click the Deploy button on the right side of the menubar to run your updated project. The Node-RED web dashboard is at http://<your-node-red-ip>:1880/ui/ (Figure 5).
Final Comment
In this article, I only looked at three command-line utilities; however, many others commands could use this technique.
Infos
- iostat: http://man7.org/linux/man-pages/man1/iostat.1.html
- lm-sensors: https://github.com/lm-sensors/lm-sensors
- hddtemp: https://linux.die.net/man/8/hddtemp
- Node-RED documentation: https://flows.nodered.org/
- Getting started with Node-RED: https://nodered.org/#get-started