
Application performance monitoring with Hyperic HQ
Monitoring Java Application Performance
Hyperic offers robust features for monitoring and managing many types of applications, but the tool provides special integration with enterprise Java applications and application servers.
When it comes to the enterprise, most system administrators need to go beyond the simple "service is up or down" monitoring of core services. The focus is instead on gathering complex metrics inside an application to understand how the infrastructure is performing. The next frontier is application monitoring. Most conventional monitoring solutions do not have the ability to poke inside the application or database without custom tools or scripts.
Hyperic has more than 70 built-in plugins for managing and monitoring various application servers, database servers, web servers, Xen servers [3], VMware ESX servers, and more. When configuring application and database servers such as WebLogic, JBoss [4], or Oracle Database and MySQL [5], it can become rather cumbersome to integrate trending of performance metrics into an all-in-one monitoring solution. Usually trending such application-specific metrics is a highly customized, manual process that requires custom scripting or writing proprietary tools.
Hyperic automatically collects the most common metrics of interest in almost all of the most popular database servers, application servers, middleware, and network equipment. Hyperic trends performance data for these types of applications and platforms, automating what is otherwise a time-consuming, high-overhead process.
For example, if a JBoss application server is running on the target host, the HQ Agent will automatically discover the JBoss server and collect metrics such as transactions, JVM heap usage, thread count, hibernate statistics, and active connections (Figure 3). Hundreds more application metrics can be graphed, trended, reported, and alerted on, and each application's metrics are custom tailored to be relevant to the type of application. For example, when installing the HQ agent on a server running an Oracle or MySQL database, the application metrics show SQL statistics in addition to the other application metrics.
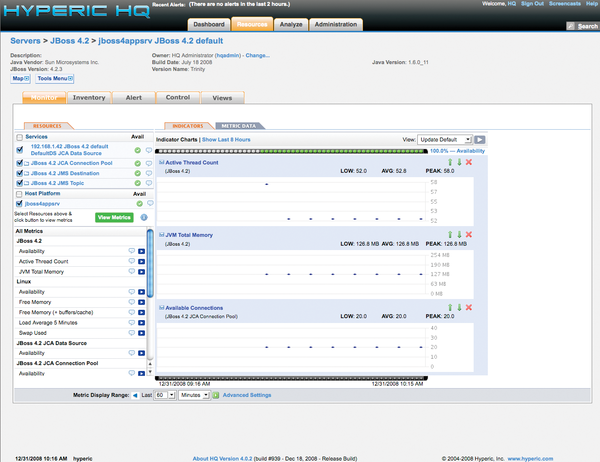 Figure 3: JBoss application metrics in Hyperic HQ.
In addition to the default metrics available for the standard 70 officially supported application plugins, custom metrics can be developed and implemented for items not present in the system of logical defaults. The Hyperic website has a list of products and technologies that HQ can natively manage and trend.
Managing JBoss with Hyperic's JMX Integration
For a closer look at Hyperic HQ in a real situation, consider the case of a JBoss Java application server. JBoss is an excellent choice for a Java Application Server platform; a free, open source community version of JBoss is available at http://www.jboss.org/jbossas/downloads/.
The first step in monitoring JBoss is to enable and configure the Java Management Extensions (JMX). JMX is a standard Java API that allows for default and custom monitoring of various attributes related to Java applications and the Java Virtual Machine.
The Sun JDK exposes certain MBeans to the user by passing the -Dcom.sun.management.jmxremote argument, which allows you to connect to the Java Virtual Machine's MBeanServer via JMX. This feature lets you access metrics from the JVM itself with Hyperic HQ or any other JMX client.
To access the JBoss MBean server through JMX, you need to pass some additional parameters to JBoss at startup. JBoss includes a start script to set all parameters that can be modified to include custom management arguments. The arguments can also be passed to the JVM on the command line, but it is better to keep them stored in a script.
To enable JMX remote connections and enable access to the JBoss MBeanServer, start by making a copy of $JBOSS_HOME/bin/run.sh to modify:
cp $JBOSS_HOME/bin/run.sh $JBOSS_HOME/bin/run-jmx.sh
Next, add an environment variable at the beginning of this run-jmx.sh script to set the custom JMX monitoring arguments (Listing 3). The JMX options that are specific to JBoss and the Sun JVM have been separated for modularity and put in the JAVA_OPTS argument, which is used by JBoss at start time.
Listing 3
JBoss Startup Script
Now set executable permissions
chmod 750 run-jmx.sh
and start JBoss with the -b <public IP address> option. Otherwise, JBoss will only bind to the localhost address and startup messages will be written to the console.
First make sure the network configuration is set up properly in the /etc/hosts file. Leaving this file as a default can cause problems with port bindings on the application server.
Once the message that follows is written to the console, the server will be up and ready for monitoring with JMX:
15:09:44,394 INFO [Server] JBoss (MX MicroKernel) [4.2.3.GA (build:
SVNTag=JBoss_4_2_3_GA date=200807181439)] Started in 9s:380ms
To discover automatically the JMX services of the Sun JVM, modify agent.properties to include this line:
jmx.sun.discover=true
If the agent is already running, the above line will require that you restart the agent, as in the following line:
/usr/local/hypric/agent-4.0.2/bin/hq-agent.sh restart
Customizing JMX Queries
Now that JMX is enabled on the server and imported into Hyperic, a massive selection of monitoring and trending options is available. With the use of regular expressions on particular MBeans and attributes, you can create custom queries and then import them into the monitoring dashboard for trending over time. This strategy is especially helpful when monitoring custom applications that have their own custom JMX MBeans and attributes because Hyperic lets you centralize the monitoring with a standard interface. For more information on customizing and extending the Hyperic JMX plugin, see the Hyperic website.
« Previous 1 2 3 Next »
Buy this article as PDF
(incl. VAT)
Buy Linux Magazine
US / Canada
UK / Australia
Subscribe to our Linux Newsletters
Find Linux and Open Source Jobs
Subscribe to our ADMIN Newsletters
Support Our Work
Linux Magazine content is made possible with support from readers like you. Please consider contributing when you’ve found an article to be beneficial.

News
-
Endless OS 6 has Arrived
After more than a year since the last update, the latest release of Endless OS is now available for general usage.
-
Fedora Asahi 40 Remix Available for Macs with Apple Silicon
If you've been anticipating KDE's Plasma 6 for your Apple Silicon-powered Mac, then you're in luck.
-
Red Hat Adds New Deployment Option for Enterprise Linux Platforms
Red Hat has re-imagined enterprise Linux for an AI future with Image Mode.
-
OSJH and LPI Release 2024 Open Source Pros Job Survey Results
See what open source professionals look for in a new role.
-
Proton 9.0-1 Released to Improve Gaming with Steam
The latest release of Proton 9 adds several improvements and fixes an issue that has been problematic for Linux users.
-
So Long Neofetch and Thanks for the Info
Today is a day that every Linux user who enjoys bragging about their system(s) will mourn, as Neofetch has come to an end.
-
Ubuntu 24.04 Comes with a “Flaw"
If you're thinking you might want to upgrade from your current Ubuntu release to the latest, there's something you might want to consider before doing so.
-
Canonical Releases Ubuntu 24.04
After a brief pause because of the XZ vulnerability, Ubuntu 24.04 is now available for install.
-
Linux Servers Targeted by Akira Ransomware
A group of bad actors who have already extorted $42 million have their sights set on the Linux platform.
-
TUXEDO Computers Unveils Linux Laptop Featuring AMD Ryzen CPU
This latest release is the first laptop to include the new CPU from Ryzen and Linux preinstalled.